To compare the means of more than two data sets at once, you can use the 1-way ANOVA hypothesis test. This tool is called “1-way ANOVA” because the data sets should differ in only one way (and “ANOVA” is short for ANalysis Of VAriance). For example, perhaps your company has a process that is performed by five different people (operators) using the same standard work, materials, and procedures. The one difference is the person doing the work. If you wanted to measure, say, their average time to complete the process, you could use 1-Way ANOVA to do it. The following example shows how this tool works.
Suppose you wanted to see if five operators completed the standard work in the same amount of time. The first step would be to record how long it took each operator to complete the work. Multiple samples for each operator would be required so that an average could be calculated. For our example (shown below, we have twelve time-samples each for operators 1, 2, and 3, and thirteen each for operators 4 and 5.
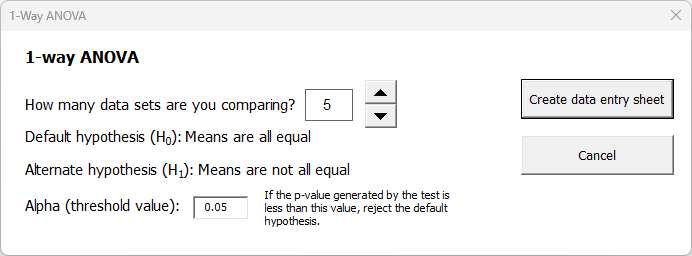
To analyze the data, create a template in SuperEasyStats by clicking the “Compare data sets” button and selecting the “1-way ANOVA” option. You will be asked how many data sets you want to compare; change the counter to 5.
Next the two hypotheses are shown. By default, we will assume the means of all five datasets are the same. The alternative hypothesis is that they are not all the same. But we know that the five datasets won’t all have exactly the same mean. After all, they’re random samples, so we should not expect them to all have the exact same mean–that would be very unlikely. What we want to know is if some of the means are so different from one another that we can conclude that the difference is more than just due to sampling, but because some of the operators really do have different cycle times from the others.
The alpha value is the criteria we will use to decide if we should stick with our default hypothesis or reject it in favor of the alternative hypothesis. Alpha is a decision rule for rejecting the default hypothesis. If we want to be 95% confident that the some of the averages are really different, then we need to set alpha to 0.05 (the default value in the dialog). But if we want to be even more confident (say, 99%), then we would need to set the alpha to 0.01. In this case, let’s say 95% is good enough, so we’ll leave the alpha at 0.05. Then we click “Create data entry sheet”.
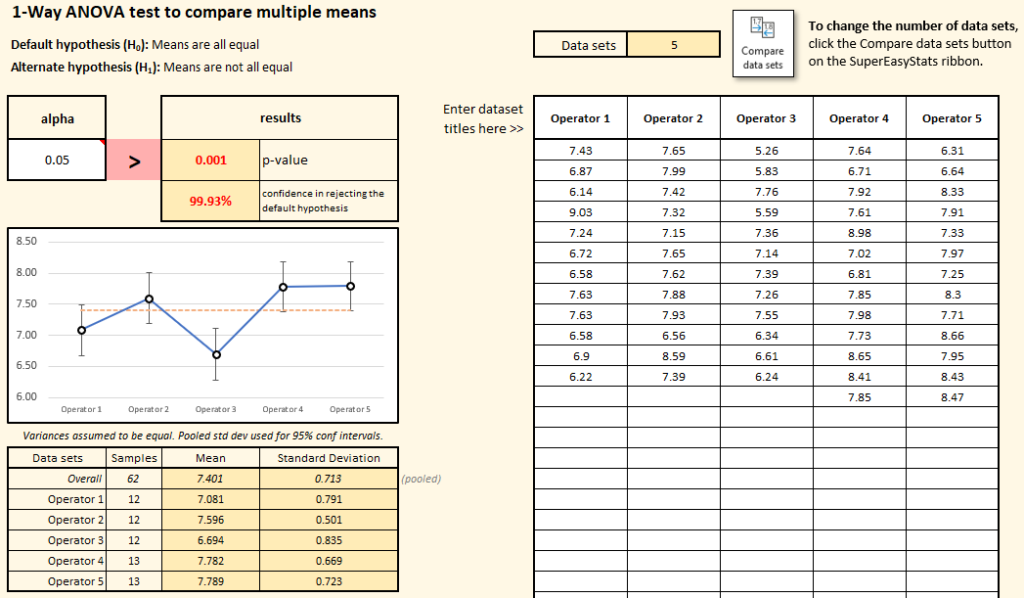
The data entry sheet has columns for each of our five data sets, so we enter (or paste) our data into those columns. Once we do, a p-value is calculated telling us if we can be at least 95% confident that at least some of the means are statistically different from each other. If the calculated p-value is less than our chosen alpha value (0.05 in this case), then we have met our threshold, and we can reject the default hypothesis and accept the alternative.
In this example, the p-value is 0.001, which is well below our alpha. Some of the means really are different from the others. In the graph you can see each of the means along with confidence intervals for each. The fact that some of the confidence intervals don’t overlap is a visual confirmation of the fact that we have enough evidence to reject the default hypothesis. These means are not all the same!