Use this test to determine if there is a statistically significant difference between the medians of multiple data sets. The data sets do not have to fit any particular distribution.
As an example, let’s consider a company that periodically surveys its customers to understand their level of satisfaction with the services that the company provides. Each quarter they send out a survey asking customers to rank those services on a scale of 0 – 10. From this they can calculate various metrics (for example, net promoter score). But as the company works to improve their customer service, they are interested to know if the median response value has changed. To test this, they gather data from four quarters worth of survey results. To analyze the results, they need to set up a template by clicking the “Compare data sets” button on the SuperEasyStats menu and selecting “Mood’s Median Test”.
When selecting this test, SuperEasyStats will ask how many data sets you want to compare. In this example, the company wants to compare data from the previous four quarters, so they choose four data sets:
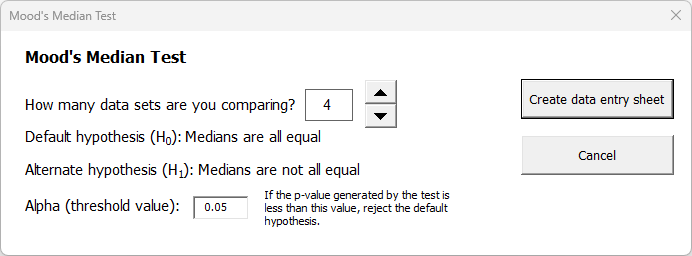
The default hypothesis is that the medians of the four data sets are essentially the same. Unless they have statistically rigorous proof to the contrary, they will stick with the default hypothesis. The alternative hypothesis–which they will only conclude if they have sufficient proof–is that the medians are not equal.
Before they can proceed, they need to decide at what point they will reject the default hypothesis and accept the alternative. They do this by selecting an alpha value. In this case, they want to be 95% sure the medians are not equal before they discard their default hypothesis, so they set the alpha value to 0.05. Then they click “Create data entry sheet”.
In the template that is created, they enter the survey responses from the previous four quarters into the columns on the right and examine the results:
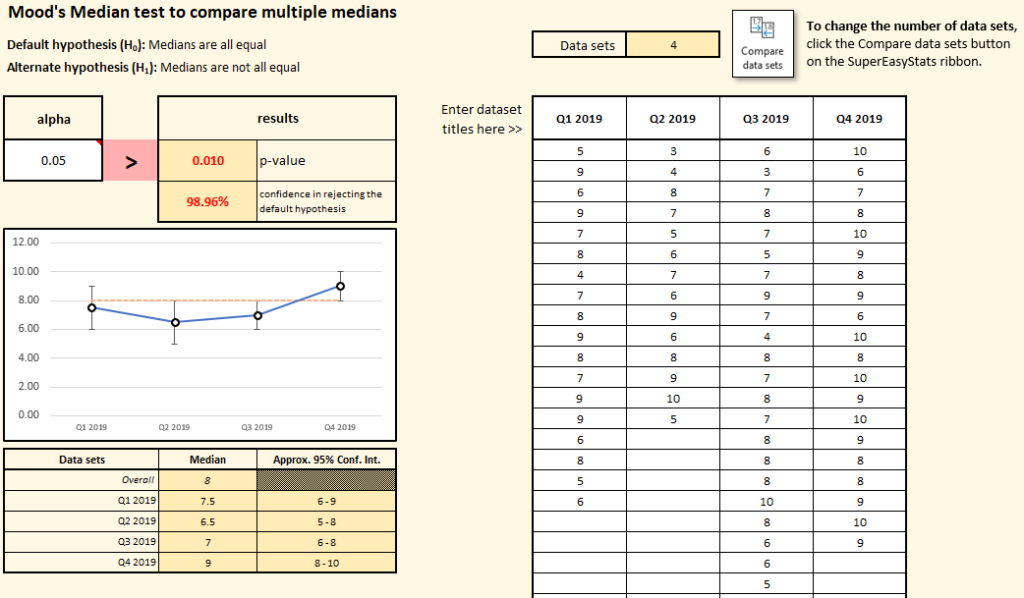
In this case they see that the p-value is lower than their chosen alpha value. They have met their own threshold and are now able to say that the medians are not all equal (i.e., they accept the alternate hypothesis). To get a sense of where the major differences lie, they examine the summary columns on the left. Notice that the confidence intervals for Q1 and Q4 overlap, but the confidence intervals for Q2 and Q3 do not overlap with the confidence for Q4 interval. This is a strong indicator that the medians in Q2 and Q3 are statistically different from the median for Q4. Investigating why that is would be the next step.