 If you would like to compare the proportions of two data sets that are based on “pass/fail” type assessments, you can use the Test of Proportions. To get started, click the Compare data sets button on the SuperEasyStats ribbon.
After clicking the button you will see the Hypothesis Test selection dialog, as shown below.
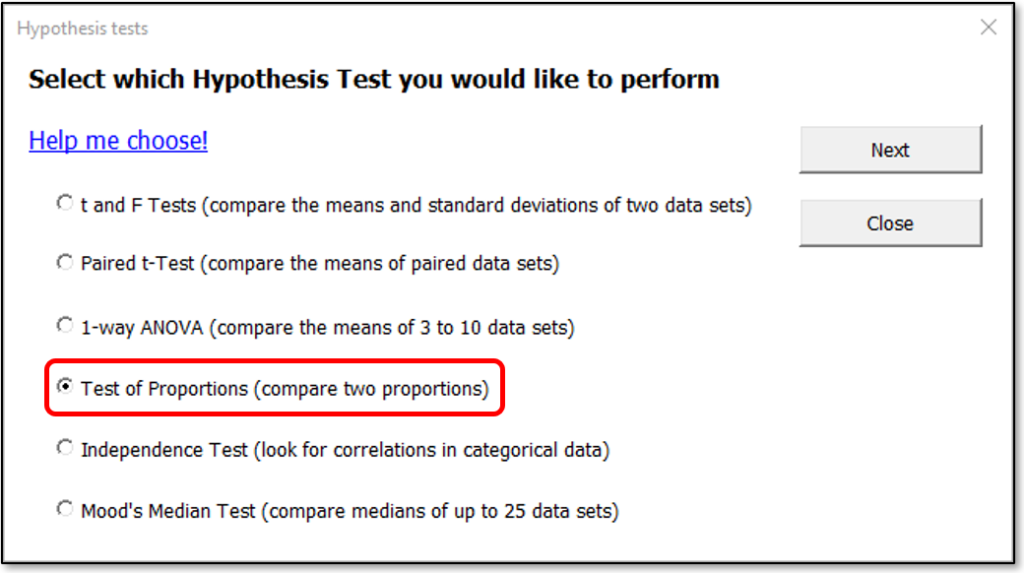
Select “Test of Proportions” and click the Next button. SuperEasyStats will create a template into which you can enter your data. Let’s look at an example: Imagine we want to determine if there is a difference in the proportion of expense reports with errors between the HR and Legal departments.
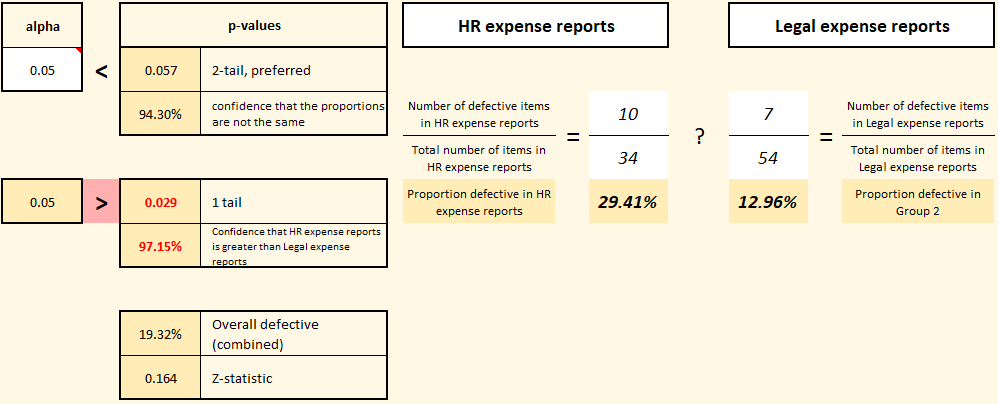
The first step is to choose your alpha value. What’s that? Well, in traditional hypothesis testing, we begin by assuming that the characteristic we’re assessing (proportion of defective expense reports in this example) is the same for both departments. Our default hypothesis (H0, also known as the “null-hypothesis” or “h-naught”) is that each department (HR and Legal) has the same proportion defective. We won’t be willing to reject that default hypothesis unless we reach a certain confidence level that they’re different. The key question you need to answer is: how confident do you need to be? That’s where alpha comes in. Notice the cell in the upper left labeled “alpha”. That’s where you set your decision rule. If you want to be 95% confident that the proportions are different before rejecting H0, then set alpha to 0.05. If you want to be even more confident (say, 99%), then set alpha to 0.01. It’s up to you! After you’ve chosen your alpha value, then simply enter the proportions and take a look at the resulting p-values.
The p-values are the result of a statistical calculation meant to determine how likely it is that the two proportions would be this different if they truly were part of the same distribution. If the p-value ends up being lower than your chosen alpha value (i.e., your decision rule), then you can confidently reject H0 and accept the alternative hypothesis (known as H1 or “h-one”) that these two data sets most likely have statistically different proportions. The two-tail p-value is the more sensitive test, and is recommended when reporting results, however the one-tail p-value is included for completeness. In this case, the two-tail p-value is quite close to the chosen alpha value. It may be worth increasing the sample size to see what happens (as an exercise, create one of these templates and double the numerators and denominators for each proportion and see what happens).
Copyright 2022 David Margil