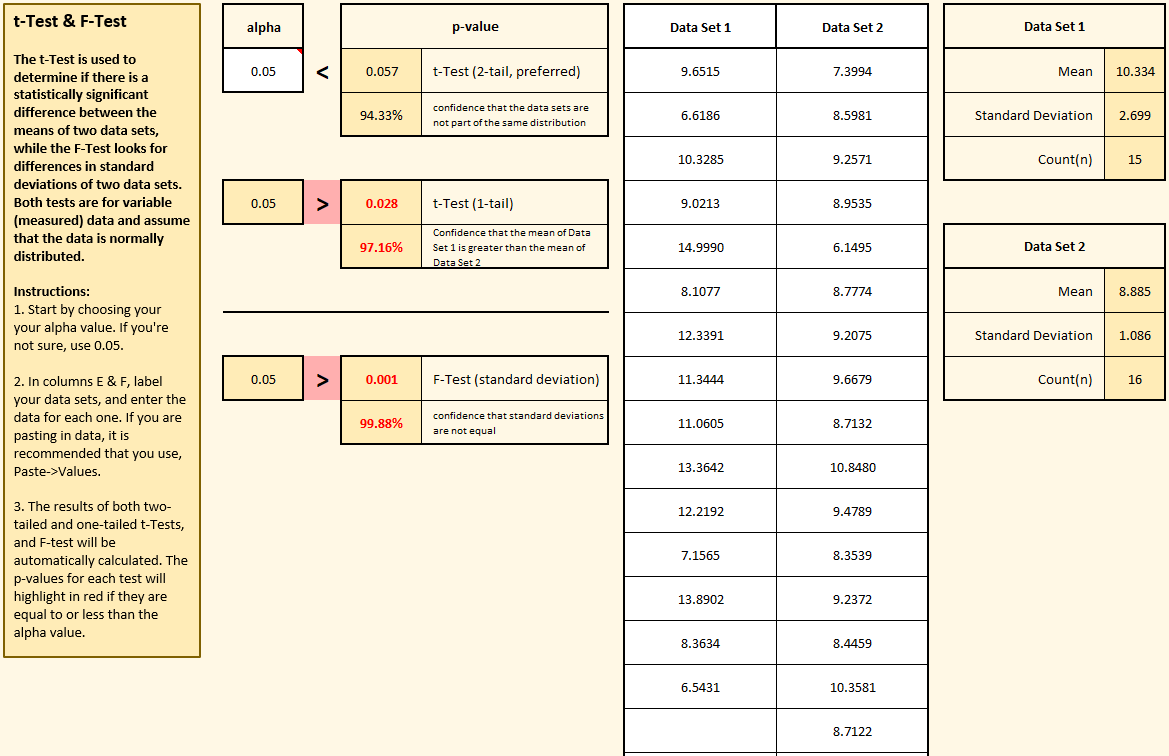
In the example on the right, two sets of data were tested using the “Compare two data sets” button. This template allows you to evaluate, statistically, if the means and standard deviations are likely to come from the same distribution.
In traditional hypothesis testing, we begin by assuming that the characteristics we’re assessing are the same for both data sets. So in this case, our default hypothesis (H0, also known as the “null-hypothesis” or “h-naught”) is that means and standard deviations are the same for both data sets. We won’t be willing to reject that default hypothesis unless we reach a certain confidence level that they’re different. The key question you need to answer is: how confident do you need to be?
That’s where alpha comes in. Notice the cell in the upper left labeled “alpha”. That’s where you set your decision rule. If you want to be 95% confident that the data sets have different means before rejecting H0, then set alpha to 0.05. If you want to be even more confident (say, 99%), then set alpha to 0.01. It’s up to you!After you’ve chosen your alpha value, then simply label each data set and enter their values. The template automatically calculates p-values for two and one-tailed t-Tests and the F-test. the t-Tests compare the means of the two data sets, while the F-test compares the standard deviations. (when reporting p-values for the mean, the two-tail p-value is recommended as it’s a more stringent test, but the one-tail result is included for completeness.)P-values are the result of a statistical calculation meant to determine how likely it is that the means and standard deviations of these two data sets would be this different if they truly were part of the same distribution. If the p-value ends up being lower than your chosen alpha value (i.e., your decision rule), then you can confidently reject H0 and accept the alternative hypothesis (known as H1 or “h-one”) that these two data sets most likely come from different distributions.
NOTE: It is quite possible (and not uncommon) to have a low p-value for the mean and not for the standard deviation, or vice-versa.
