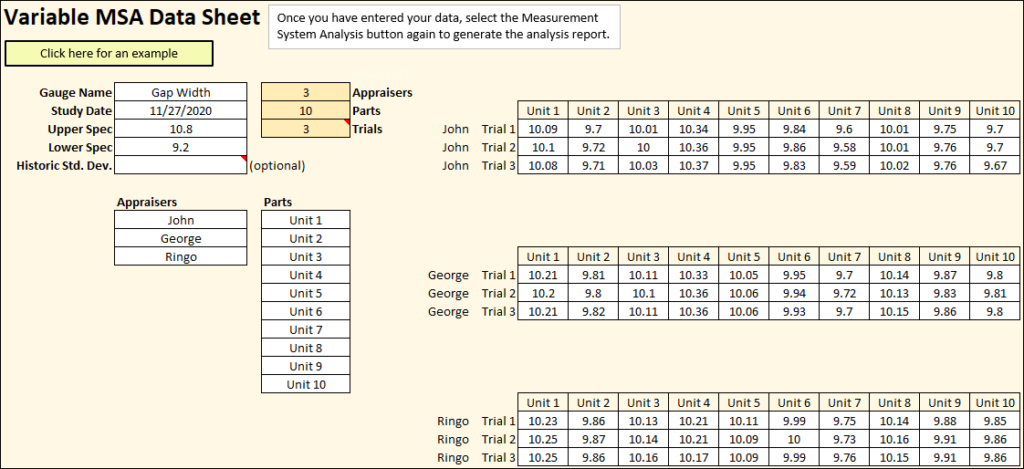
In this example we are looking at an inspection station at a manufacturing facility that is measuring the space between two features on a component. The operators performing the measurement are using Vernier calipers to measure the gap. The specification says the gap should measure between 9.2 and 10.8 mm. Ten different parts were measured by three different operators three times each. To create a template in which to record the data, click the “Measurement System Analysis” button in SuperEasyStats and fill in the fields as shown:

A data sheet will be generated, and you can fill in the specification limits, appraiser names, and the actual measurements. Here is the data that was collected:

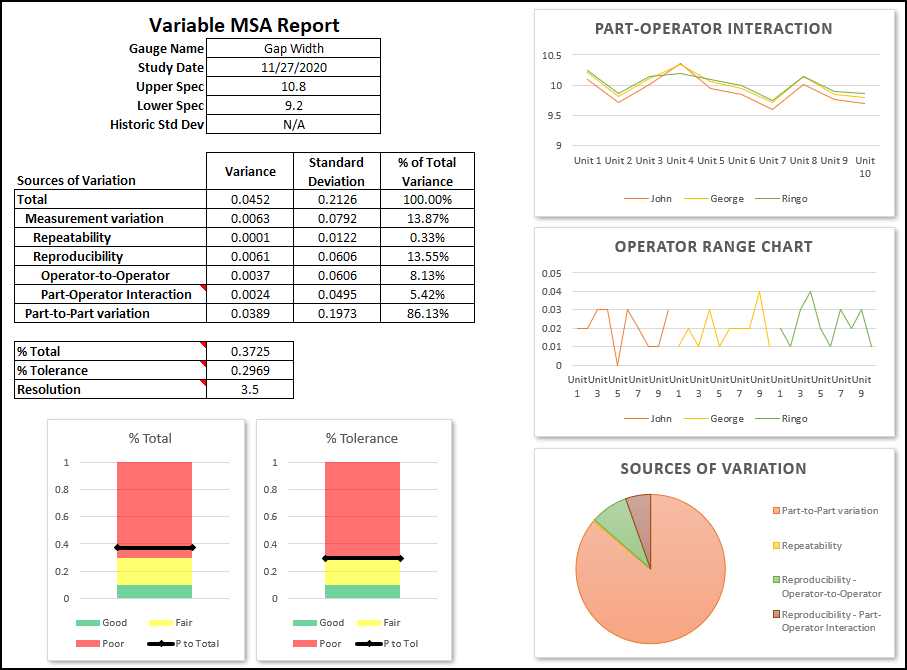
After collecting the data, clicking the “Measurement System Analysis” button again will generate the following MSA report.

- In the table on the left, we can also see that Resolution is low (3.5). Generally a resolution of at least 5 is recommended. Low resolution suggests that the measurement system is having a hard time distinguishing the difference between parts.
- The left-hand stacked-column chart shows that % Total is 0.3725, which puts this in the measurement system in the unacceptable range. This means the measurement error is large compared to the variation of the parts you measured.
- The right-hand stacked-column shows that % Tolerance is just barely marginal at 0.2969. This means that your measurement system is only barely capable of determining if parts are within the given specification.
- The table shows that there is a small Part-Operator Interaction, and the graph in the upper right indicates where it might be. If you look closely at the graph, you can see that while the operators aren’t getting exactly the same answers as each other for every part, the differences in operator from part to part are fairly consistent, except for part 4, where Ringo inexplicably got a lower answer then both George and John despite the fact that he had been getting results slightly higher than the two of them for all the other parts. It might be worth checking on what happened with Ringo and part 4.
- The pie chart in the lower right shows that the largest source of variation are the parts themselves, but measurement error accounts for 13.87% of the total variation. Just about all the measurement error comes from Reproducibility (in fact, the pie-slice for Repeatability is so small that it’s not visible on the chart). This means that while individual operators are consistent with themselves, there is big differences between the operators. This suggests that the operators have different techniques that are affecting the results.
It is strongly recommended that improvements be made to this measurement system. The results can guide us as to where to concentrate our efforts. As a starting point, the problem with Reproducibility suggests a single technique be established, SOPs updated, and the operators retrained. After that, another MSA should be conducted, and further investigation may be needed if there are still problems.
