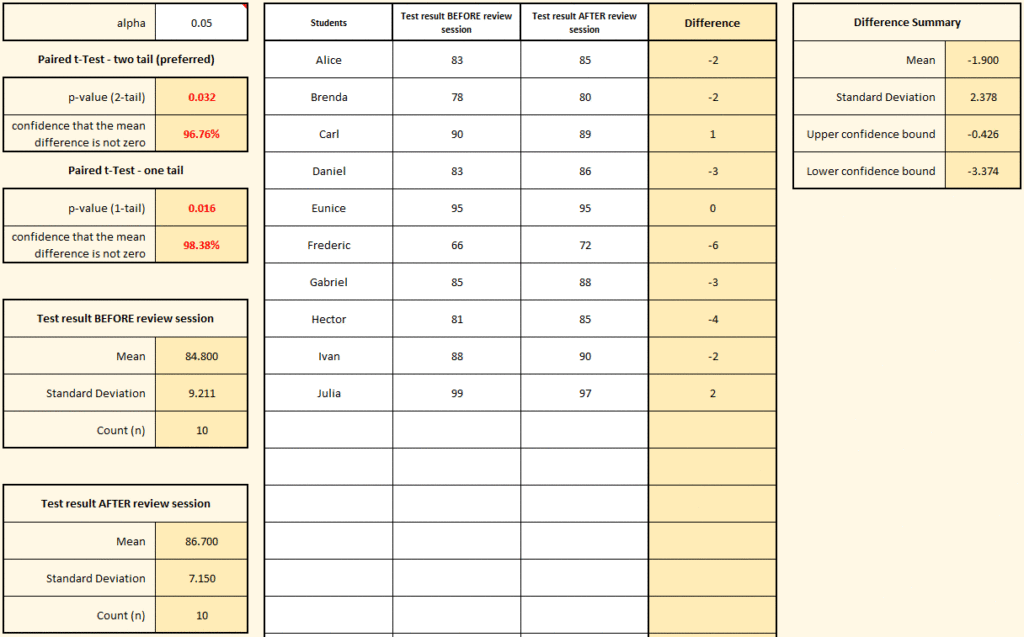
In the example on the right, a Paired t-Test was used to determine if a topic review session was effective in improving the scores of a group of students. Since each student was tested twice (before and after), their scores have a paired relationship.
As shown in the example, on average, the mean score before the review session was 1.9 points lower than the score after the session. This is can be seen in the “Difference Summary” section in the upper right. Also note that the range created by the Upper and Lower confidence bounds does not include zero, which means it is highly likely that the difference is not, in fact, zero. In other words, it is likely that the scores before and after truly are different, as indicated by the p-values shown on the left, which have highlighted in red since they are lower than the chosen alpha value.

Copyright 2020 David Margil
